Climate Change Risks: Vital Vegetation Sensitivity Index Map
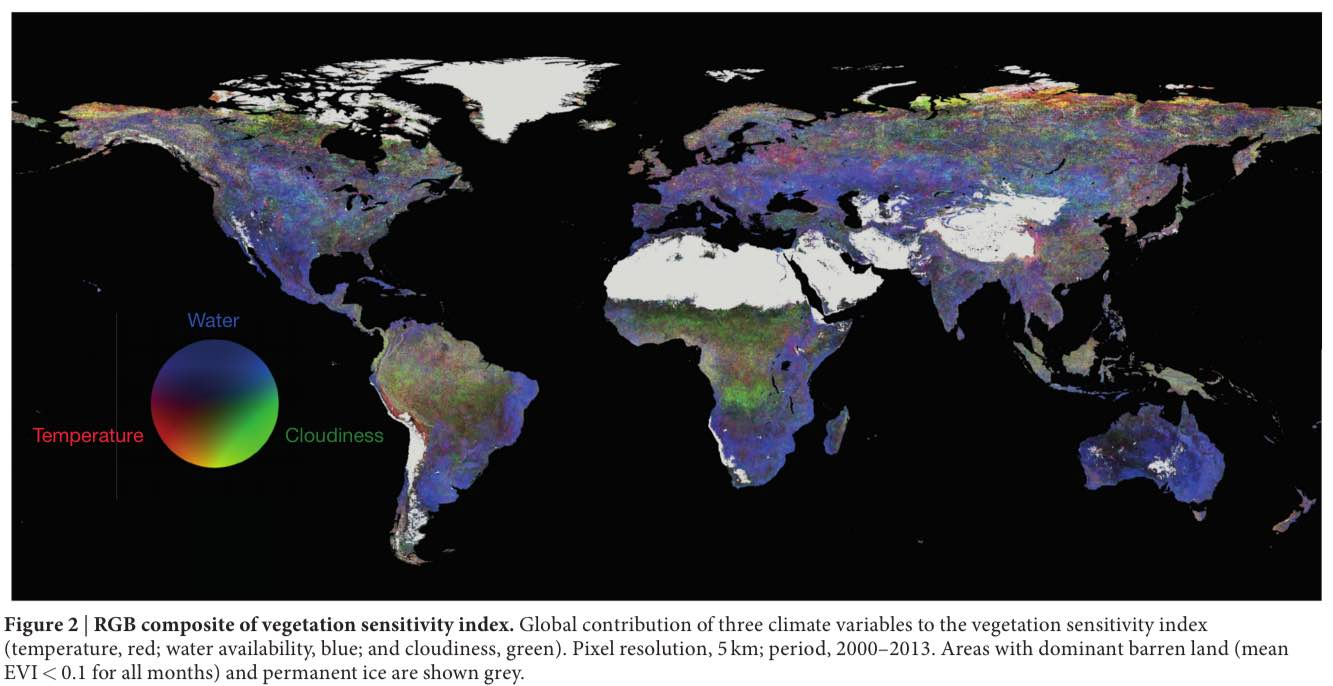
Climate change risks are becoming increasingly apparent as researchers unveil alarming data regarding our planet’s vulnerability. A recently developed vegetation sensitivity index map illustrates these risks by pinpointing the most affected regions around the globe, utilizing advanced satellite data analysis to monitor environmental shifts. This innovative approach brings to light the severe threats posed by climate change, which can drastically transform ecosystems and foster instability across vulnerable regions. Understanding the environmental impact of climate change is critical for developing effective mitigation strategies, particularly for ecosystems rated low on the resilience scale. As global temperatures rise, this map serves as an essential tool for predicting future ecological challenges where plant life is at stake, giving us a glimpse into the ongoing fight against climate change.
The hazards associated with global warming have sparked considerable research into the resilience of various ecosystems. This encompasses the examination of sensitive ecological regions that exhibit distinct responses to climatic fluctuations. Through climate change mapping, scientists identify critical areas at risk, heavily relying on satellite data to analyze environmental transformations. Such insights are invaluable in forecasting the repercussions of changing climate variables on biodiversity and ecosystem health. By understanding these dynamics, we can better prepare for and address the ecological challenges that lie ahead.
Understanding the Vegetation Sensitivity Index (VSI)
The Vegetation Sensitivity Index (VSI) is a crucial tool used by researchers to assess the ecological health of our planet in relation to climate change. By leveraging satellite data analysis, the VSI reveals patterns of vegetation coverage over time, allowing scientists to pinpoint areas most susceptible to the impacts of climate change. Through a meticulous process that analyzes temporal variations in plant life, the VSI provides an invaluable baseline for understanding how different ecosystems respond to shifting climatic variables such as temperature and moisture availability.
Research published in Nature discusses the development of this index, highlighting its significance in environmental studies. By collating satellite observations from the Moderate Resolution Imaging Spectroradiometer, researchers have crafted a comprehensive climate change map that visually represents the sensitivity of various regions. The VSI thus serves as a vital piece of the puzzle, integrating complex environmental data into a format that can be easily understood and applied in climate resilience planning.
Frequently Asked Questions
What is the vegetation sensitivity index (VSI) and how does it relate to climate change risks?
The vegetation sensitivity index (VSI) is a crucial indicator designed to assess how various ecosystems respond to climate change risks. Developed using satellite data analysis, the VSI maps areas based on their plant coverage over the years. It helps identify vulnerable regions that are more likely to be affected by fluctuating climate variables such as temperature, moisture, and cloudiness, providing essential insights into environmental impacts.
How does a climate change map identify vulnerable regions on Earth?
A climate change map utilizes satellite data and the vegetation sensitivity index to highlight vulnerable regions on Earth. By analyzing various ecological factors, the map reveals areas that show heightened sensitivity to climate change risks, allowing researchers and policymakers to focus on regions that may require priority intervention and adaptation strategies.
What are the ecological implications of the vegetation sensitivity index regarding climate change risks?
The vegetation sensitivity index has significant ecological implications as it reveals which ecosystems are most at risk from climate change. By analyzing satellite data, researchers can pinpoint regions with lower resilience that are more susceptible to climate variations, thus understanding the potential environmental impact of climate change on these vulnerable ecosystems.
What role does satellite data analysis play in understanding climate change risks?
Satellite data analysis is crucial for understanding climate change risks, as it provides precise measurements of vegetation, temperature, cloud cover, and water availability across different regions. This data feeds into the development of tools like the vegetation sensitivity index, enabling researchers to assess ecological sensitivity and identify the most vulnerable areas on the planet.
Which areas are identified as most vulnerable in the context of climate change risks?
Research has identified several vulnerable regions regarding climate change risks, including the Arctic tundra, boreal forests, tropical rainforests, global alpine zones, and various steppe and prairie ecosystems. These regions, highlighted on climate change maps using the vegetation sensitivity index, showcase heightened ecological responses to climate variability, marking them for immediate attention.
How does climate change affect water availability and what does this mean for vulnerable regions?
Climate change significantly impacts water availability, a critical factor identified in the vegetation sensitivity index. Vulnerable regions may experience alterations in rainfall patterns and water resource accessibility due to rising temperatures and changing cloudiness. Understanding these dynamics is essential for managing risks and developing strategies to enhance resilience in those affected areas.
What does the color schema on climate change maps signify?
The color schema on climate change maps indicates the contribution of various climate variables to the vegetation sensitivity index. Red represents temperature variations, blue illustrates water availability, and green denotes changes in cloudiness. This visual representation helps identify the specific climate change risks affecting different ecological zones.
How do researchers determine which regions require more attention regarding climate change risks?
Researchers use the vegetation sensitivity index along with satellite data analysis to determine which regions require more attention regarding climate change risks. By assessing the resilience of various ecosystems and their sensitivity to climate changes, they prioritize areas that are more vulnerable and in need of immediate action to mitigate potential environmental impacts.
| Key Point | Details |
|---|---|
| Vegetation Sensitivity Index Map | A newly developed map that shows the most vulnerable locations on Earth affected by climate change. |
| Vulnerability Indicators | Highlights plant coverage and uses satellite data to reveal threats to different ecosystems. |
| Climate Change Variables | The map shows different contributions from temperature (red), water availability (blue), and cloudiness (green). |
| Ecologically Sensitive Regions | Identifies sensitive areas such as Arctic tundra, boreal forests, tropical rainforests, and more. |
| Implications | These areas have lower resilience, indicating a higher likelihood of crossing critical climate thresholds. |
| Further Reading | For more insights, refer to the publication in Nature concerning climate change risks. |
Summary
Climate change risks represent one of the most critical threats facing our planet today. Recent research has highlighted vulnerable regions using a vegetation sensitivity index map, which utilizes satellite data to pinpoint areas at risk. This approach not only sheds light on specific ecosystems that may be disproportionately affected but also aids in predicting key environmental changes. Understanding these risks is essential for prioritizing conservation efforts and developing strategies to enhance resilience in the most affected areas.
